Q3 earnings reports are mere weeks away, which means that Q3 has been over for a couple of weeks. That means I got my hands on some new iBuyer data. I’m compiling some Denver data (which I’ll post later in a different post) but the easy comparison is for Phoenix.
In case you don’t recall, or joined VIP after it was posted and haven’t dived back into the archives, here’s the post on Q2 iBuyer comparison. But I posted the numbers below so we can look at Q/Q changes, which are interesting.
Let’s see what Q3 had for us.
The Comparison
First, here’s the Google Sheets spreadsheet. I believe you can click through and look at the numbers yourself. You’ll notice that I expanded the chart so as to include the Q/Q comparison for each company.
Interesting, eh?
Some caveats about the dataset.
Since I posted the Q2 Comparison, I’ve been trying to get more data.
What we know is that Zillow has said that it asks for Seller Concessions that are equivalent to their estimated Renovation Costs. Zillow at least does not use Seller Concessions as a profit center. We don’t know if Opendoor and Offerpad, which are private companies, do the same or if they use Seller Concessions as a way to squeeze out a few bucks of profit.
Holding Costs — we have Zillow’s national numbers for Q2, but I took the step of trying to estimate holding costs for Phoenix metro using averages for things like utilities, HOA fees, property taxes. Obviously, that is not specific property-level holding cost data, but… it’s something.
Renovation Costs — in a way, I don’t think this is important since at least one of the three companies clearly states that its Seller Concessions = Renovation Costs. So they net out in a way. But I will note that we only have Zillow’s national numbers from quarterly reports; we’ll see what they report for Q3.
With that said, there are some interesting takeaways from the data.
The Takeaways
The biggest eye-opener is Opendoor’s dominance in Q3.
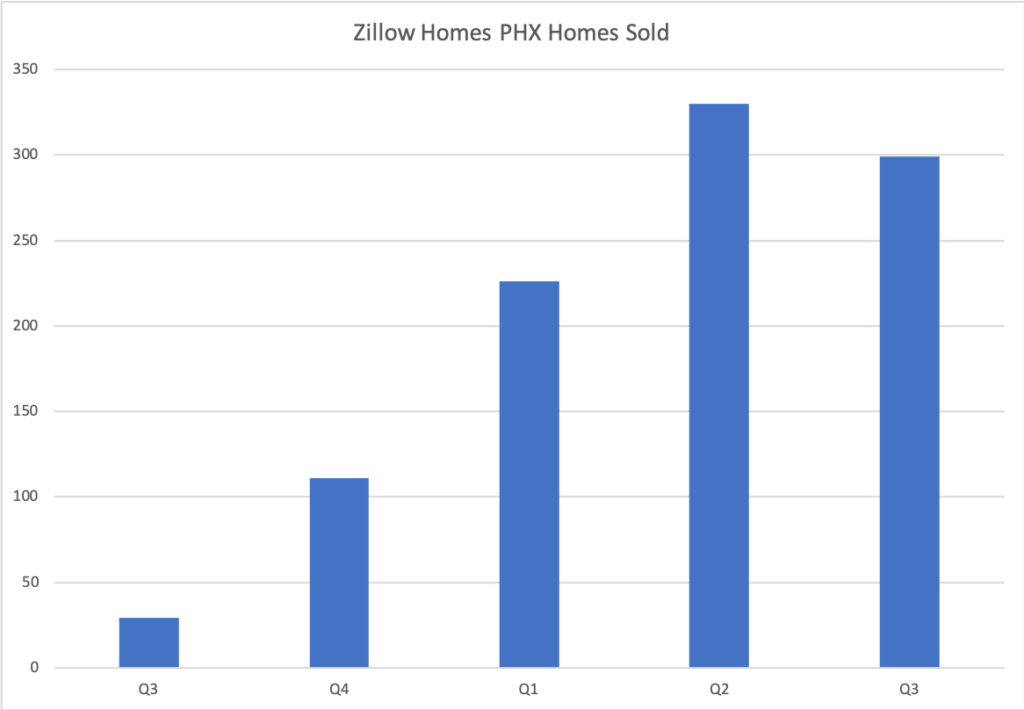
While Zillow and Offerpad both sold fewer homes in Q3, and quite substantially fewer, Opendoor sold 17.4% more. In Q2, Zillow sold 330 to Opendoor’s 574, or 57.5%; in Q3, those numbers are 299 to 674, or 44.4%.
Similarly, I estimate that Zillow’s revenues went down by almost 8% while Opendoor’s revenues skyrocketed by 20%. At least part of the reason for the big difference in revenues between these two has to do with Opendoor’s average profit per trade going up by 6.2% to $9,312, while Zillow’s fell almost 90% to $249. Is that intentional by Zillow to try to get more properties? Or is it that Zillow’s algorithms were not doing all that well in Q3? I don’t know, and no one outside of Zillow does. But it is striking.
Whatever the reason, I think it’s clear that Opendoor dominated Phoenix iBuyer market in Q3.
But then, note that Zillow deals in a much higher price point: Q3 average purchase price was 323,417 for Zillow and 252,461 for Opendoor. (Offerpad competes head-on with Opendoor at average purchase price of 251,895.) That’s almost $71K more… almost enough to suggest that those two companies aren’t actually competing. They might be trying to play in a certain price segment instead and limit overlap.
That might blunt the Opendoor Regnant narrative a touch, but still… Zillow shrank, while Opendoor grew. So there is that.
Consumer Impact
On these numbers, it is just striking how much better Zillow is for potential sellers. The average seller would have net a measly $2,496 for an additional 3.7 months on the market had he chosen to list with a REALTOR over selling directly to Zillow. But that amount is $10,263 for Opendoor and $12,943 for Offerpad — and that’s without knowing the realities of what those companies demand in Seller Concessions, for 3.1 and 2.8 additional months on market.
Furthermore, over 35% of sellers to Zillow would fared better by selling to Zillow because they net more that way vs. selling with a REALTOR. Now, does that have to do with Zillow potentially mispricing things, which led to their poor performance in Q3? Maybe. But the consistent lower margins, consistently lower profit/loss from the trade, all suggest a systemic issue here.
Said systemic issue is not necessarily a negative one for Zillow. In fact, I think it’s a signal of real strength. Zillow can afford to make far less money, can afford to leave more on the table, than do Opendoor and Offerpad, because it effectively has no marketing costs for its iBuyer program. It generates far more requests for offers from its website than it can service; Opendoor and Offerpad have to do far more marketing and pay more to generate offers in the first place.
Of course, the minute I wrote that sentence, I remembered watching the very first Zillow Offers TV commercial on NFL football yesterday.
So maybe there will be some advertising costs for Zillow after all.
Still, I think it’s a massive competitive advantage that could be showing up in the numbers.
Trouble for Zillow in Q3 Earnings?
Obviously, we won’t know for a couple of weeks, and obviously, I’m speculating like crazy here. But… I was rather shocked to see the sale numbers drop in Q3 in Phoenix. Look at the Q/Q growth trends:
Sure, the Y/Y looks impressive as all hell, but Zillow’s been growing like gangbusters in PHX each of the past 4 quarters… and then a drop? An actual decrease? If the trend of the last 4 quarters had continued, Zillow would have sold somewhere in the 400 homes range, instead of the 299 they posted.
If this was an isolated thing in Phoenix alone, then we shouldn’t hear anything in the earnings about a slowdown. But if it isn’t, then Q3 could be troubling. (I will say that Denver data looks great for Zillow so far, but they’ve only been in operations there since Q1 of this year, and look at the growth rate for Phoenix for the first three quarters of operations.)
We shall see what Rich Barton & Crew discuss in the earnings call, but I do hope somebody will ask them about this. And I can’t wait till Opendoor and Offerpad go public.
In any event, hope this was useful and entertaining for y’all.
-rsh


