
This will be a very brief post, as I’ve got a ton of work to do. But I had to put this up somewhere just to get some thoughts.
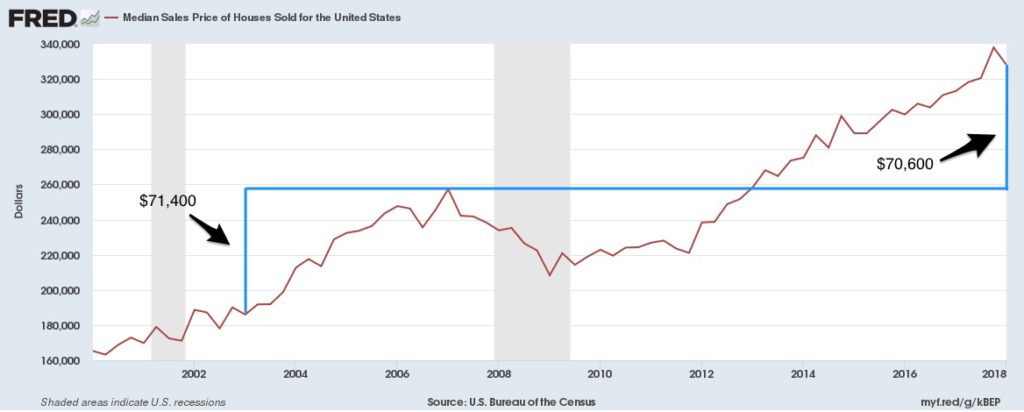
As you can see from the image above, we are now roughly at the same point ABOVE the height of the real estate bubble in Q1 of 2007 as that point was above Q1 of 2003. I know, I know this is in unadjusted dollars and as far as I know, this is not adjusted for inflation either.
But that is the St. Louis Federal Reserve’s FRED data for Median Sales Price of Houses Sold (including both new construction and existing home sales). I’m a little nervous about it.
- In Q1/2003, the median sale price in the U.S. was $186,000.
- In Q1/2007, the very height of the Bubble, the median sale price was $257,400. The difference between the two was $71,400 — meaning that the median house in the U.S. cost that much more in 2007 than it did in 2003.
- In Q1/2018, the median sale price was $328,000, or $70,600 more than it was in Q1/2007.
Once again, I realize that just because homes are overvalued doesn’t mean we’re in a bubble. Many an eminent economist has said so. For example, Lawrence Yun of NAR:
“Home prices are clearly rising too fast, they have outpaced people’s income growth for the past five years,” [Yun] said. “Is it a bubble in terms of potential to go down? The answer is no, because the fundamental supporting factors of today’s housing market versus what happened 10 years ago are drastically different.”
Drastically different or not, I’m just curious whether anyone else looks at the chart above and gets just a wee bit nervous.
Ok, back to work!
-rsh


19 thoughts on “Anybody Else Nervous About This?”
I think to get a feel if we are at the top again look at what all the institutional investors are doing behind the scenes. The are on wallstreet and have all the meta data. I work with multi-billion dollar hedgefunds in the secondary mortgage market and all the big funds have quit buying and are selling off as much of their portfolios as they can.
I have been worried for the last year or so. A lot of it has been gut feelings, but I am just waiting for the market to slow down or crash. Hoping for the first rather than the latter.
Wanna know why I’m REALLY worried?? Because my lender is laying off 10% of their salaried staff. Because a local lender just laid off 32 employees. Because the changes the lenders are getting for is not fun. Been there, done that.
Seems to me that inflation adjustment is paramount to this discussion. According to Bureau of Labor stats, us dollar inflation (purchasing power loss) is a little over 18% since 2007. That’s a lot of room for housing prices to grow, going purely on stats. Median family income has only just recently increased, which might negate the inflation aspect. Hard to say.
I almost fell over when my new clients told me they pre-qual’d for a conventional 3% down loan. These are 20-something’s, not established borrowers. When the banks start giving away their money again is when I get nervous.
I am with you!
It would be interesting to see the numbers removing all residential sales over $2m in 2002, 2007 and 2018.
The only thing certain in residential real estate are the industry’s cycles. They happen. Brace for impact.
I did a little checking and it’s scarier than even that.
Figuring a 3% increase on the median family income in 2018 over 2017 (which I think is a reasonable increase), that comes to $61,000.
Divide that by the 328k and you get 18.6% – family income divided by home price.
Take the same numbers for 2007 and you get 22.6% ($58,149 divided by $257,400).
That says people in 2018 have to stretch their finances even further than they did in 2007 to buy a comparably priced home based on the current data. And that’s before taking inflation into account.
Are the factors different today than in 2007 as Lawrence Yun says? Yes, but if that’s not a bubble, I’d really like to know what it is.
Simon
That is some great next-step analysis, Simon. Thank you.
Supply and Demand- Economic 101 will kick in. When housing prices force more than 50% of the buyers out of the market – it is not good.
However, look at big areas where educated professionals, nurses, teachers and others can not afford to buy homes and you see the threat of America becoming a renter nation.
That is what is truly scary.
House prices in many parts of the United States have recovered from their depths at the time of the 2008 financial crisis. But, this recovery gone too far!The Government creates another housing bubble without a doubt.Some real estate investors our firm represents are convinced that we are in a bubble. Most of them will not sell since there is nothing else to buy that really make sense, once they enter their 1031 exchange.Many are sitting on the fence not buying anything, waiting to see what the market will bring.
July 23 at a closing, I asked the loan officer, “Does any one in your bank talk about a bubble? ” Answer, “No, but the customers do!”
I saw a news article that some mortgage broker in CALIF said they would accept a 500 credit score.
Seems like FHA will accept a 540.
Sheila – Home prices are not reachable by a huge % of the population and rentals are the same. Where are those people gonna live?
I look for the bubble to pop late 2018 or early 2019.
I always track the fundamentals:
Home sale sides
Median price
Inventory
First time buyers
New home delivery
Interest rates
Affordability index
Household formation
Job creation
Unemployment rate
10 year treasury yield
All point to where we stand in a cycle and combined with conversation with agents and consumers….here’s what I see:
Demand is still strong although the “smart buyer” is moving to the sideline as a result of price and where they think we stand in the cycle.
Inventory weak (down 36 consecutive months), however, new home delivery is closing the gap on the deficit. New deliveries have been under serving the market since the beginning of the recession 10+ years ago. With permits and deliveries in the pipe, inventory will stabilize and eventually rise.
Prices up for 75 consecutive months. Far more than wage increases and with rising mortgage rates (watch the 10 year Treasury), affordability has declined significantly. Look at the west….barely above par of 100.
So what’s it mean?
Buyers get nervous about prices and affordability. Demand begins to wain.
New deliveries outpace demand and inventory grows.
Demand and supply impact pricing and we will see a flattening and eventual decline.
As that starts many sellers will come to the market to catch the peak, but will miss and inventory will grow further.
And the cycle continues…less demand, more supply, falling prices.
Timing: mid 2020 into 2021. Of course, every market has its own dynamics.
As we all know, this is a cyclical business. I’ve lived through many. Nothing to be nervous about…this is not 2008. The market doesn’t dictate our success – we do. Back to the fundamentals and what it takes to be successful.
“The supply of homes for sale increased annually in June for the first time in three years, according to the National Association of Realtors, but sales fell for the third straight month.”
https://www.cnbc.com/2018/07/24/southern-california-home-sales-crash-a-warning-sign-to-the-nation.html
” * Sales of both new and existing houses and condominiums dropped 11.8 percent year over year, as prices shot up to a record high, according to CoreLogic.
* The median price paid for all Southern California homes sold in June was a record $536,250, according to CoreLogic, a 7.3 percent increase compared to June of 2017.
* In the past, California, one of the largest housing markets in the nation, has been a predictor for the rest of the country.”
I’ve been asking my self this question A LOT! “Should I be nervous?” After selling my home in Charleston to relocate to Greenville (Let’s get a coffee!)
https://fred.stlouisfed.org/series/MSACSR
We’re at early 2006 levels of inventory, and what ultimately caused the market to “crash” was the sudden influx of inventory as you can see in the chart. So my question is what could cause a sudden influx of inventory in this market?
Right now we have stupid low rates just coming back to reality. That’s going to curtail demand which is bad for sellers. However over 50% of owners have an interest rate below 3.75% https://www.housingwire.com/articles/43854-core-logic-mortgage-rates-average-a-7-year-high
That’s a big incentive to stay put, remodel, etc. Regardless of where rates go housing is a basic need, and one facet of daily life. Other factors sometimes weigh on our lives more greatly than the current interest rate. People are still getting married, having children, getting jobs, getting divorced, etc.
What ultimately drove my decision to move was the large amount of equity I found myself sitting on, and I felt that equity would be better invested elsewhere. A lot of my neighbors are feeling the same, and inventory this year has increased in my little micro-market significantly. (I’m also seeing folks with astronomical prices getting brought back down to earth via price reductions). Will that trend continue to the point of oversupply? Again looking at the average rate owners are sitting with, the price they’ll pay to upgrade, the demand still out there, and I can see a floor for the market to stand on.
Combine all of this with rising rates pulling buyers off the table, and it feels like Christmas time when parents finally say enough is enough with this years hot toy “you’re getting a football.”
So am I nervous? A fed raising rates, a moron starting a trade war, and a system that is most certainly cyclical; all of this makes me worry. Enough to tolerate living with 2 dogs in an apartment? Not yet.
Funny, we’re not seeing anything like that in my market in the New York suburbs (I don’t cover NYC), which is probably consistent with much of the northeast.
I can’t post a picture, but I have a graph here that shows the northern suburbs of NYC (Westchester, Putnam, Rockland, Orange, Duchess counties).
https://drive.google.com/file/d/17JxmPllh42BhbraaezRpBtRhIjMMvGG_/view?usp=sharing
The average sales price is basically where it was in 2004, still well below 2008 highs. And that’s true in pretty much every market in the region. We’ve had sales go up for almost seven years, tailing off this year because of either/both a lack of supply and/or the tax reform hit to blue state home ownership, but those increasing sales haven’t yet driven meaningful price appreciation. We’re starting to see a little bit now, but it’s still mild. We’re nowhere near getting back to 2008.
So I don’t know if the national data is masking some regional undercurrents. It might be that we’re heading for a correction nationally that would obviously have some impact in my market. But I don’t think that we’re overvalued right now.
I’m not a financial expert and I’m not much of a numbers guy, but the thought occurs to me that the broader trend we have for a growing wealth gap would suggest that housing cost for the average American is simply rising as a percentage of income and will continue to do so. Any thoughts on that and how it relates to this discussion?
Yes and No. In my area we had about 22K listings last July 17 and right now we have about 18K. In 05 total number of listings was under 6K. That was the entire Phoenix Metro area – which was crazy low. I am not seeing frenzied buyers or investors buying at any price like I did in the 04 to 06 market when we had bus load of people coming into town and buying up anything and everything. Now depending on the price point homes sell quickly in the low to mid range all things being equal. In our mid high to higher end many sellers price to high and end up coming down in price after being on the market for a LONG time. A
What does concern me is how easy it is for buyers to obtain loans for not much down. It concerned my back 04 to 06 and even more so now. You’d think people would remember how bad our area was hit and hedge against that. I know I sure am.
Comments are closed.