I left out any predictions about the housing market in 2023 in my Seven Predictions post for a bunch of reasons. The most important being that it’s really kind of boring for people who are not super interested in the topic, which means just about everyone who isn’t a VIP subscriber.
But now that 2023 is here, I spent a few minutes looking at some… ah… “alternative” analysis that happens to be my thesis for what will happen to housing market in 2023. I figured I would make that prediction here, early on, as it is January 5th as I write this, and see just how wrong I am at the end of the year.
TL;DR: One of two things will happen in 2023 — Reversion or Divergence. If home prices revert to the money supply, then we will end 2023 with home prices down about 4% from the peak in June of 2022. If, on the other hand, home prices come un-moored from the money supply, then prices should drop by 22% from the peak, thereby erasing most of the gains throughout 2021 and 2022.
If you’re interested in finding out what the hell any of this means, and why I came to this conclusion, read on. Please be warned that I am playing economist here and economics is the dismal science even for professionals.
My Hypothesis: Reversion or Divergence
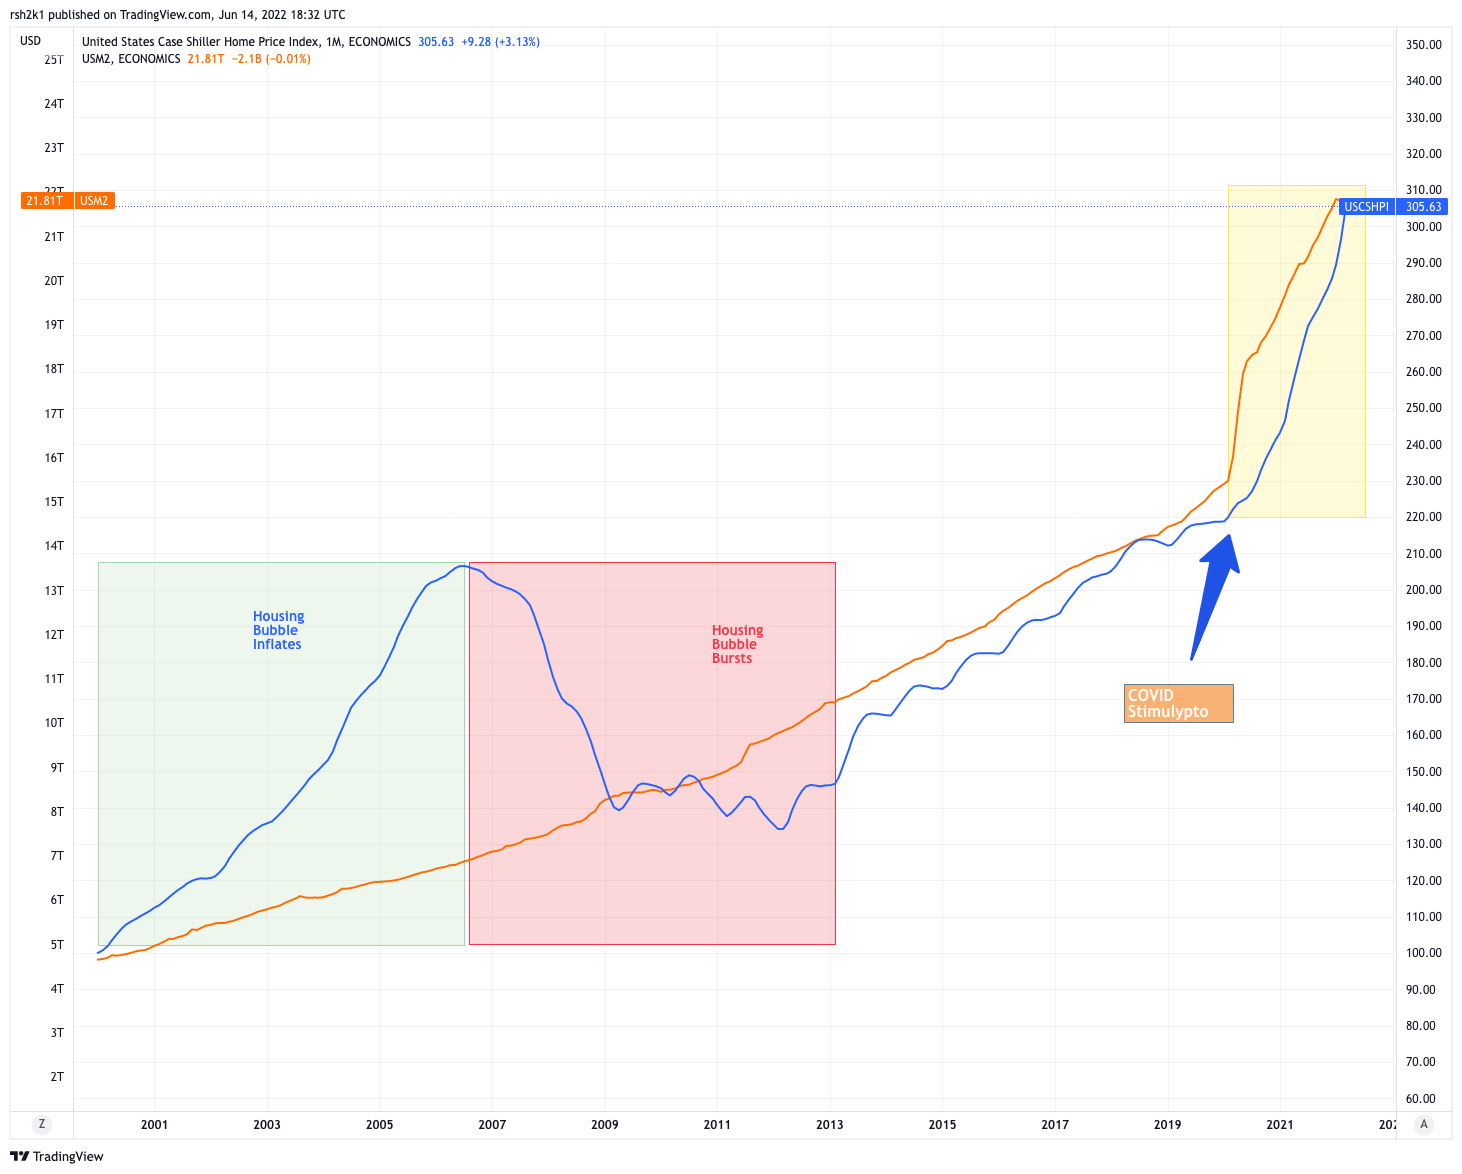
Longtime readers know that I have a particular hypothesis about home prices in the United States, namely that we did not actually see home prices go up. What we actually saw was dollar devaluation driving up the nominal price of homes. I think this because there is this incredibly odd correlation between home prices (as represented by the Case-Shiller Index) and US M2 money supply:
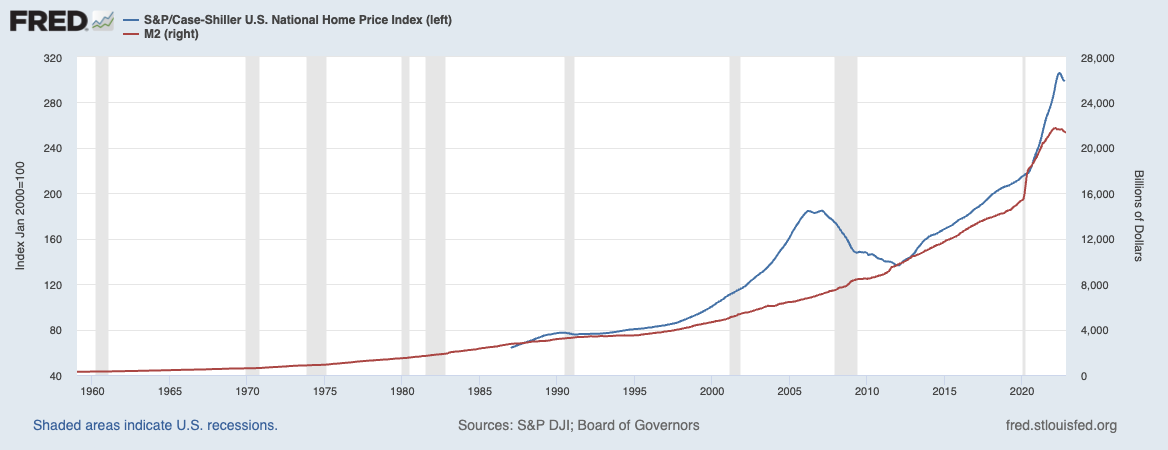
As we can see, other than the Bubble Years of 2000 to 2007, home prices more or less track money supply. If we go back further than 2000, we see this correlation as well.
What’s difficult to accept about this hypothesis is that it means home prices have very little to do with classic economic laws like “supply and demand.” That can’t be correct… yet the correlation holds. Prices have little to do with things like mortgage rates, except fraternally — meaning, both mortgage rates and home prices are a function of the money supply.
The incredible run-up in home values in 2020 and 2021 had nothing to do with job growth, with COVID, with anything other than the fact that the money supply went through the roof. Conversely, now that the Fed has changed course and started tightening to fight off inflation, the nosedive in housing also had nothing to do with job growth, Ukraine, or anything other than money supply decreasing.
Home prices go up when the dollar is devalued; home prices go down when the dollar appreciates. That’s the core idea.
Now, the second half of 2022 presents a challenge to this idea.
M2 and Home Values in 2022 and 2023
So let’s look at a version of the above chart starting in January of 2019:
At least on the data available on TradingView, the M2 money supply actually decreased throughout 2022 by about $300 billion. Here’s YCharts showing $21.65T in January of 2022 and $21.35T in November of 2022. This is the first actual decrease in the money supply, as opposed to a slowdown in growth of the money supply, since 2010.
What’s challenging to my thesis is that home prices absolutely plummeted, out of line to the decrease in the money supply. What 2022 data shows is that the money supply declined by about 2.5% from the peak while home prices took a huge tumble. From the peak in June to October, the Case-Shiller index dropped 5%… in three months. That’s insane.
There are likely many reasons, but the big one has to be that buyers were priced out of homes once mortgage rates started climbing as interest rates were raised. In fact, as EPB Research shows, mortgage rates climbed faster than treasury rates and stands at a 30 year high in spread between mortgages and treasuries.
This is where the Either-Or scenario comes into play.
Either, we get home prices reverting to the historical trend line for M2 money supply, or we get divergence between home prices and money supply for the first time since… well, ever.
So What of 2023?
What I did is simply assume the trend in money supply continues throughout 2023.
Now, why I think I am sure to be wrong is that no one actually knows what the Fed will actually do throughout the year. If I actually knew what the Fed will do, it means I am from the future and should be running a hedge fund using my future knowledge — something Marty McFly should have been doing instead of playing guitar at school dances. For the purpose of funalytics, let’s just say the Fed stays the course and reduces the money supply as it has throughout 2022.
That implies a M2 level 5.2% below the start of 2022 at about $20.7T or so at the end of 2023. What about home prices?
The Question Is…
Will home prices revert to the historical correlation with the M2 money supply or will it diverge?
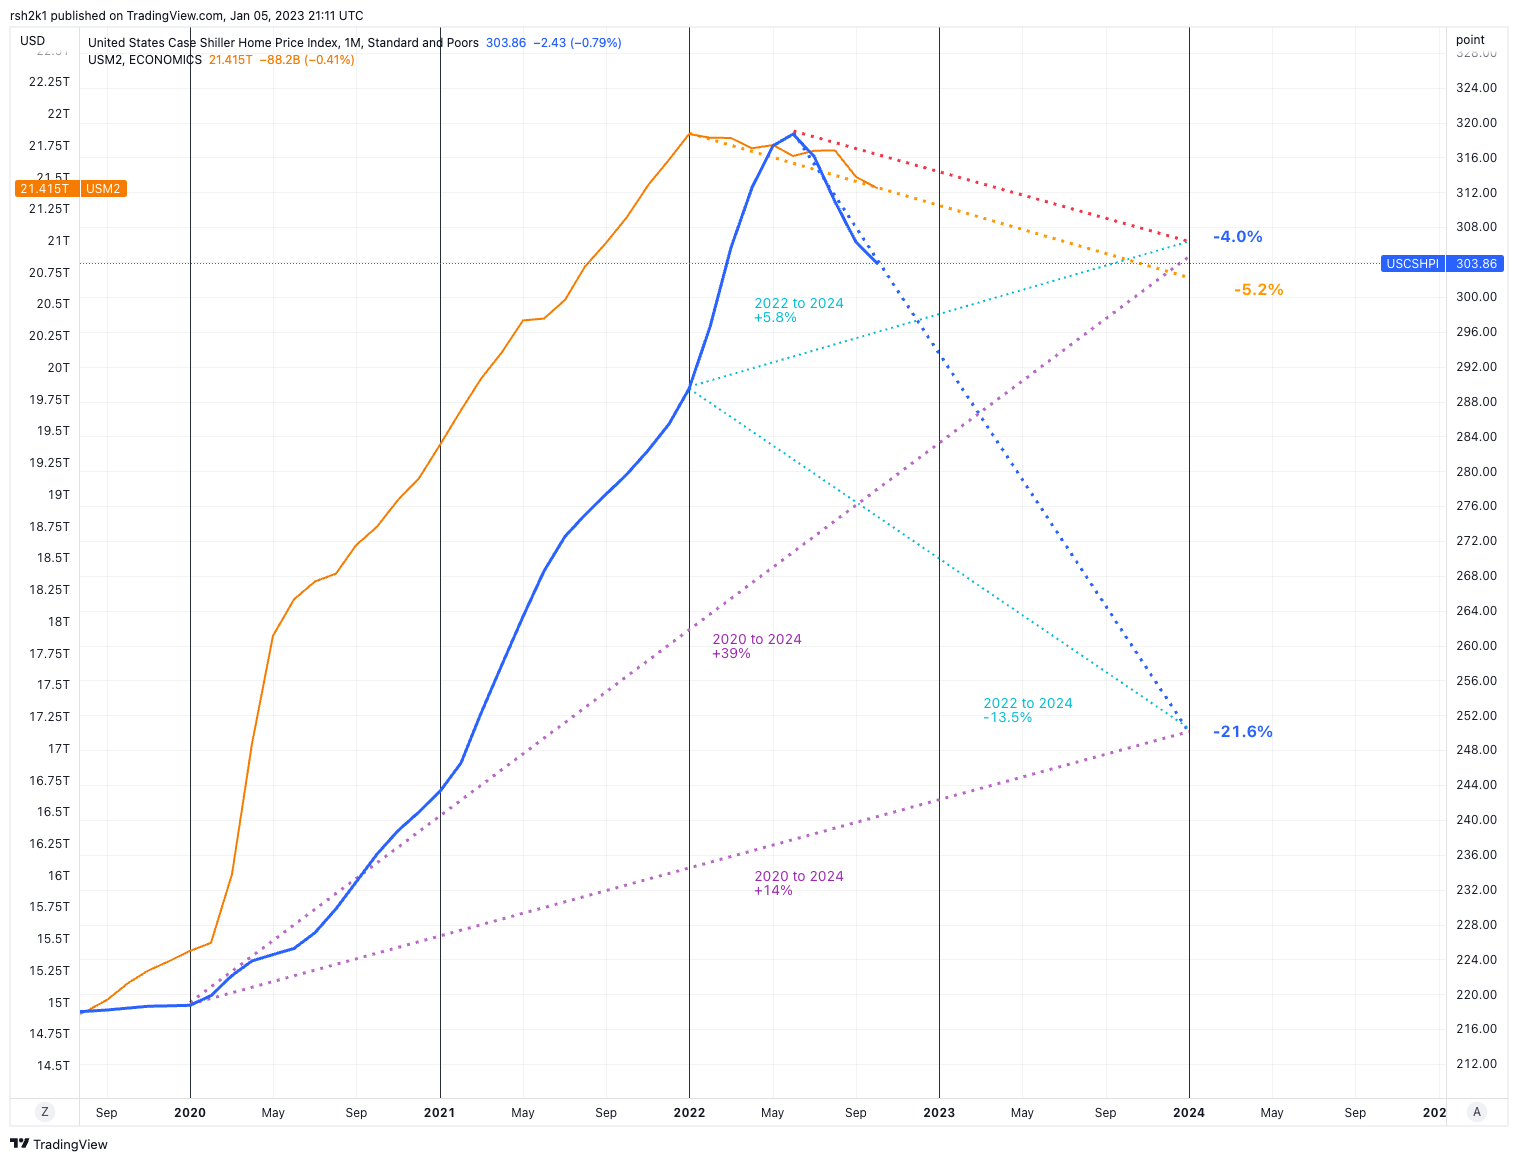
If prices revert, the implication is that home prices will actually go up slightly (or at least flatten significantly) in order to match (roughly) the decreases in M2. Under this model, home prices should decline by about 4% from the peak in June of 2022 and the Case-Shiller Index should end at about 143.5 or so.
If prices diverge, then the implication is that home prices will continue to plummet the way it has throughout the second half of 2022. On that model, we should end 2023 with a decline of 22% from the peak in June of 2022 with the Case-Shiller Index around 117 from 150 in June of 2022.
My prediction is the former: home prices will revert to the historical correlation with M2. Looking at this chart, I can’t help but think it will:
But of course… it could be different this time.
Do note that under the Reversion thesis, home prices will be up 40% from the start of 2020 when the money printing got underway in earnest. Under the Divergence thesis, home prices will be up merely 14%. In two years. Not so bad if you look at it that way.
If, however, you bought in January of 2022, then Reversion means your home value is still up 5.8% while Divergence means you will have lost 13.5% of your home’s value. That would suck. You do not want Divergence.
One Rationale for Reversion
There is one solid rationale for Reversion. Inventory levels. As in, they don’t exist. Here’s my friend Mike Simonsen of Altos Research in an excellent video on the topic:
Mike’s big takeaway is that we’re just not seeing the inventory that everybody suggested and that June 2022 data was suggesting. We ended 2022 with fewer than 500K homes for sale in the U.S. and we’re not seeing the kind of spike that was expected.
It makes sense, in a way. It makes no sense to sell your home with a 3% mortgage rate to buy a home with a 6% mortgage rate. The “move up buyer” is, for all intents and purposes, dead today. For most people, it makes far more sense to add another room to the house you already own, whatever the exorbitant cost of that is, than it does to sell your house and buy a larger one.
Fewer starter homes going on the market because people not moving up means fewer starter homes for new first-time homebuyers to buy… not that many of them were buying anyhow with the economy the way it is and rates the way they are.
And lower inventory is just fine since there aren’t many buyers in any event since so many have been priced out of the market entirely.
I think this is a decent rationale for the Reversion theory in that while lower demand drops prices, lower supply raises them. The drop in supply is keeping pace with the drop in demand, and I think we’re more likely to see more of a stalled out housing market where there are far fewer deals but at same or slightly higher prices.
One Rationale for Divergence
On the other hand… a strong argument for divergence comes from EPB Research:
The big rationale here is the difference between Existing Home Sales inventory and New Home Sales inventory, right around 3:30. What Eric points out is that Existing Home months supply is 3.3 while New Home months supply is 8.6. And as he says, there has never been a divergence like this between new and existing homes.
If New Home Supply is indeed the better predictor of future price movements, and the home builders are the ones sort of setting the price for any local area (if they are selling a 3BR/2BA house for $300K, it’s hard to sell a 3BR/2BA house for $400K, etc.) then… yeah, Divergence could be real. As Eric points out, home builders are in a very different situation than individual homeowners. They have to sell in order to stay in business, and they often have enormous loans they took on to build projects.
The same analysis applies to guys like Opendoor who are not homeowners, but are in the home buying and selling business. They have to sell at a loss if need be just to keep things going.
There is also the possibility that some investors are in a similar situation. They didn’t buy a house to live in it; they bought it to cash flow and for home price appreciation. Depending on their cost structure, their cost basis, type of rental, market conditions, etc. etc., it might make more sense for them to sell and harvest the tax loss, and move on to other investments than to hold out for higher prices.
Why I Lean Reversion
I lean towards the Reversion scenario, primarily because the available history of home prices and money supply is strongly suggestive of possibly not merely correlation, but actual causation. That is, after all, my thesis: home prices did not go up, the dollar went down. (Side note: the recent “strength of the dollar” that economists and market analysts talk about is relative to other currencies: Euro, Yen, etc. Dollar is very strong against other fiat currencies; it isn’t clear that the dollar is strong against real things like houses and food and oil.)
I also think the housing price run-up in 2020-2021 was caused primarily by individuals and families getting locked in their apartments and realizing they need some space if they’re going to live, work, eat and entertain in one building. A big chunk of the demand came from people fleeing big cities and lockdown slave states. Most of the demand, in other words, was from people who wanted to live in the house they bought.
Yes, investors were a big part of the story, and towards the tail end of 2022, we saw the highest percentage of homes purchased by investors rather than by families. But even so, we’re talking about maybe 20% (more in some markets, like Atlanta) of purchases. Now that things are unraveling, Investors panic selling will have an impact on price but I don’t think investors in that situation are even the majority of investors, never mind the majority of people who own houses.
Ergo, the expected spike in inventory is not going to materialize.
Finally, yes, new construction is in a major crunch right now as they built as the market was going nuts, and find themselves with a lot of houses in inventory. But they’re not building a whole lot of new houses now. Some of that is by choice and some of it is because they can’t get the capital to start building projects. Either way, much like Opendoor’s much ballyhooed billion dollar loss, once builders get past this short-term inventory crisis even if at big losses, they’ll be back to equilibrium afterwards since they control the supply to some extent.
And of course, 2022 was a banner year for building:
- In the last 12 months, there have been 1.482 million nonseasonally adjusted new house starts; seasonally adjusted housing starts total 1.427 million.*
- There were 1.601 million nonseasonally adjusted new house starts in 2021, which was the highest number of starts within one calendar year since 2006.
But that’s not even half of the (reduced) existing home sales of about 4 million in 2022. In a more typical year, that wouldn’t be a third. New construction could set the price in a local market, but then again… the thing about new construction is that it’s new. A lot of those homes are not where people actually want to live — closer to downtowns, closer to work, closer to existing amenities and infrastructure and the like.
I think the spike in interest rates freaked people out. In particular, it freaked out bankers who make mortgage loans. The recession (pending or already here, depending on who you ask) is increasing default risk: “unemployment” and “timely loan payment” are somewhat mutually exclusive concepts. And it likely caused a lot of potential buyers to decide to wait and see.
So the market overreacted, is overreacting, and will probably overreact for a bit longer. But over the long haul, more and more people will come to realize certain realities about the housing market:
- The Fed cannot print more houses.
- Even with the monetary tightening, the money supply is close to all-time highs.
- Housing is a necessary good, and everybody needs it in some form or another.
- Risk-on assets suck in the coming macro conditions; real estate is one of the best risk-off assets.
- The 30 year fixed rate mortgage is one of the greatest pro-family boondoggles in America; why let only hedge funds have all the fun?
- The Fed cannot print more houses.
I think the market gets more rational by the middle of 2023 and we end up at the Reversion scenario of being down around 4% from the peak in June of 2022.
Home Price Is Not the Market
Don’t get me wrong: I don’t think the housing market in 2023 will be a healthy one. We ended 2022 with about 4 million existing homes sold, more than a third below the 6.5 million in 2021 and 6.7 million in 2020. 2023 will not be much better.
Mortgage rates will remain high, unless the Fed relents from its fight against inflation. Only a grand pivot — brought on by something far worse than inflation — would result in such a thing. And as of now, there is no sign of the Fed relenting.
Along the way, the damage to the economy will result in more layoffs, more unemployment, slower business environment, and a general malaise… which means fewer and fewer people will become first time homebuyers. Those who do jump into the market will find fewer and fewer homes for sale, especially once the glut in new construction is digested.
Just because home prices are closely tied to money supply doesn’t mean that home sale transactions are closely tied. We could easily see 3 million homes sold in 2023, but at prices 4% below the high from June of 2022. That doesn’t do the industry any favors. From a volume standpoint (price x transactions), we could be looking at a bloodbath come the summer.
Brokers and agents and all of the people and companies dependent on them might panic, but that panic cannot and will not translate to homeowners sitting in their homes with 3% mortgage rates and up 40% or more in value from when they purchased. Those people have certainty and security in a very uncertain and insecure world. Buyers might panic a bit, but more and more of them can’t get a mortgage to buy a house they’d want anyhow… so the panic is more likely to focus on rents going up.
So just because home prices might not fall more than 4% or so from the peak does not mean we’ll have a strong and healthy real estate market in 2023. Quite the opposite. We are likely to have a disastrous real estate sales market this year for the industry and for the economy, with transactions breaching the lowest level since the depths of the Bubble in 2011… possibly since the 1980s.
Or… the Fed might pivot in March and we’ll see the housing market bounce back even higher as more people realize that the policy of the United States and its central bank is to make the currency worthless. Which makes exchanging that currency — or better yet, getting into a fixed rate mortgage in that currency — to buy something real, something tangible, something that provides a real personal safe space in a world gone mad that much more attractive.
-rsh


