I’ve been writing the long Four Horsemen series, and one of the biggest issues I had to tackle was housing affordability. The federal guidelines from HUD says housing is affordable when gross costs are no more than 30% of the gross income of the residents. Since gross costs include things like utilities, property taxes, mortgage interest and the like, I figure the actual price of the house should represent maybe 25% of the gross income.
That leads to the recommendation that the price of the home should not be more than 2.5 times annual income. Of course, in 2022, Fidelity thinks you should be looking at 3 to 5 times your annual income:
- If you are completely debt-free, congratulations—you can consider houses that are up to 5 times your total household income.
- If less than 20% of your income goes to pay down debt, a home that is around 4 times your income may be suitable.
- If more than 20% of your monthly income goes to pay down existing debts in the household, dial the purchase price to 3 times.
Do take into consideration that Fidelity thinks you should save at least your annual income before buying a house, so… yeah. Still, let’s say 3 times annual income is the affordability zone. I don’t know too many people who aren’t spending at least 20% of the monthly income paying down existing debts, like student loans, mortgage, car loan, credit cards, etc.
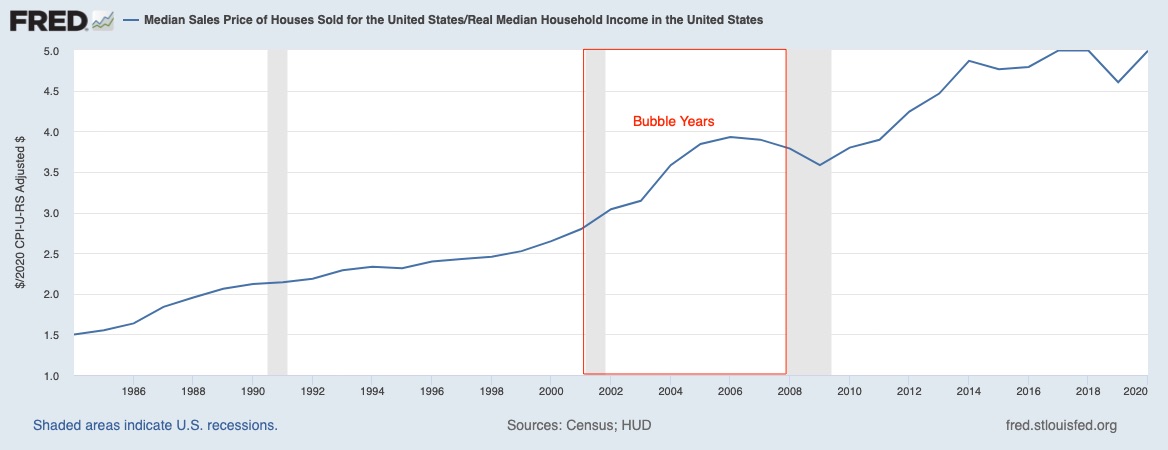
So here’s a chart of median home sale price vs. real median household income in the U.S. from 1984 to 2020.
A couple of notes here.
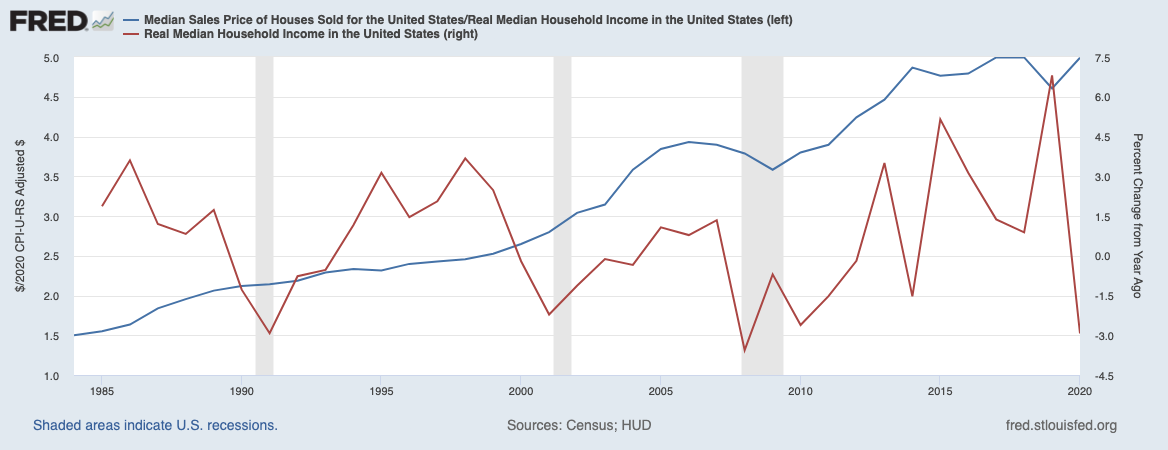
First, the big runup in the 80s and 90s might have had more to do with income growth driving demand, driving prices. Because real household income growth in the 80s and 90s (except for the recession in the early 90s) was pretty strong:
And all through the 80s and 90s, the PTI ratio was below 3: so by definition, buying a house was affordable.
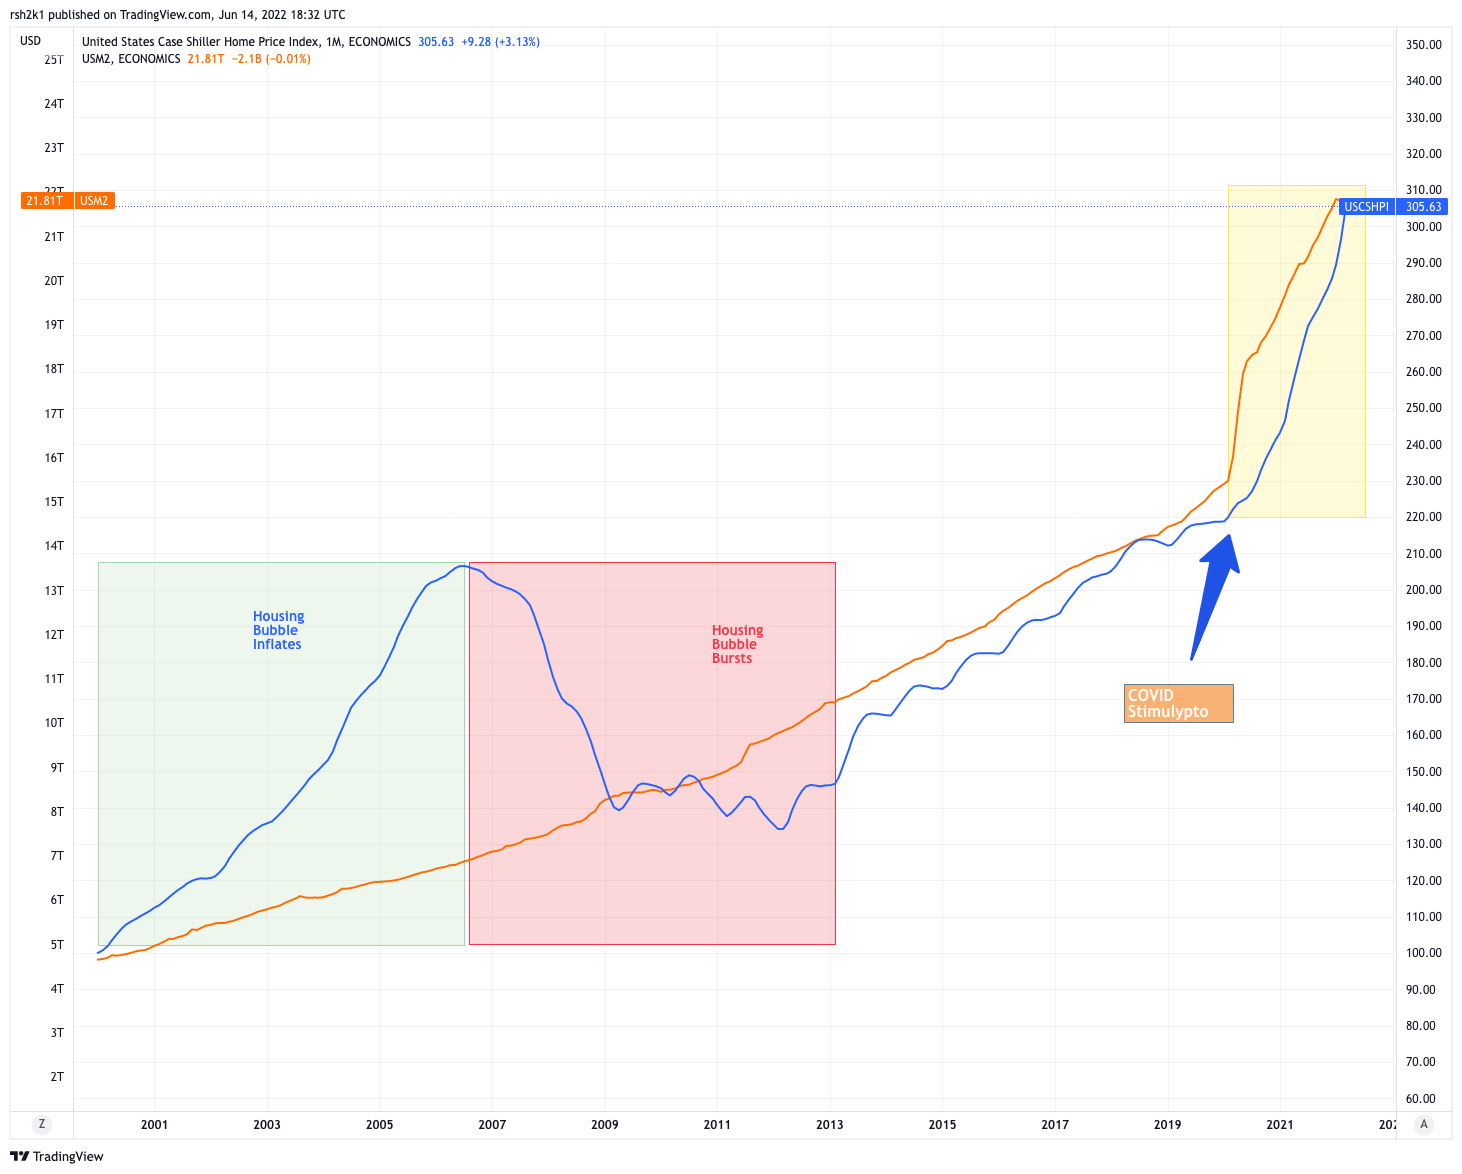
The Bubble years of 2001 to 2008 however shows weak and negative income growth. All through the 2000s, real income did not go up by more than 1.5% in any given year. But the PTI ratio never went below 3, even during the post-Bubble crash, because income suffered even more. So that’s a function of home prices continuing to rise for over a decade. I submit that it’s because of money printing:
So the question is, when was buying a home last affordable for the average American family? If we go with 3.0 PTI as the last time that housing was affordable, we’re looking at 2002 when it was 3.04 when real median income was $61,190 and the median home price was $188,700.
Ergo, with 3.0 PTI as the guide, with 2022 median income estimated by HUD at $71,300, the implication is that the median home price should be $213,900 to be affordable. It was $407,600 in May according to NAR.
Home prices would need to drop by 48% to get to affordable. And that’s using the generous 3.0 PTI ratio; using the 2.5 PTI ratio, we need to get to $178,250 in median home prices, or a 56% drop from today’s levels.
Make of that what you will.
-rsh


1 thought on “Last Time Housing Was Affordable”
Comments are closed.