Over the past few weeks, there has been a flurry of posts, articles, tweets, and other expressions of… what to call them… predictions? opinions? studies? that all drive to the idea that the US housing market is either collapsing already, or about to collapse. Because the Fed, you know? Raise rates on fiat dollars, and that raises rates on fiat dollar mortgages, which makes housing more expensive in nominal terms. That will kill off buyer demand, and so, we’ll see the housing market collapse.
Thing is… I’m not educated enough in Keynesian economics to understand what this housing collapse looks like, and when we might actually see it. There’s an odd feeling in the air as if all sorts of people are desperately seeking this housing collapse. I’m not sure why. But I figured I’d noodle on it for a bit.
The Collapsitarians
The basic argument for this housing collapse is built on two observations resulting from the Fed action to drive the economy into a recession:
- Inventory is going up sharply in most markets as sellers get FOMO; and
- More and more sellers are cutting their list prices.
A good example might be this tweet from Realtor.com Economics:
Realtor.com Economics on Twitter: “The good news is that more homeowners are listing their properties for sale, boosting inventory for the second month in a row in June. With more sellers, we’re seeing houses sit longer on the market, leading to an increase in price cuts. @GeorgeRatiu https://t.co/eFTnKKO6t3 / Twitter”
The good news is that more homeowners are listing their properties for sale, boosting inventory for the second month in a row in June. With more sellers, we’re seeing houses sit longer on the market, leading to an increase in price cuts. @GeorgeRatiu https://t.co/eFTnKKO6t3
And real estate agents everywhere are reporting that buyer interest has slowed down, sellers are wanting to list their homes, and new homebuilders are seeing terrible market conditions.
Plus, stats are showing that sales are down, month-over-month prices are down, and the market appears to be headed down overall.
An example might be from John Wake (@JohnWake on Twitter) who does some great statistics work, whether I entirely agree or not:
John Wake on Twitter: “Too Late to Sell at the Top on Arizona Real Estate Notebook https://t.co/c33RZ9mUws / Twitter”
Too Late to Sell at the Top on Arizona Real Estate Notebook https://t.co/c33RZ9mUws
So the prevailing conventional wisdom appears to be that the housing market is softening at a minimum, the age of insane bidding wars is finished, and skyrocketing prices are no more because mortgage rates are and will be much higher.
But if this is a collapse, it’s an odd one.
Wen Prices Collapse?
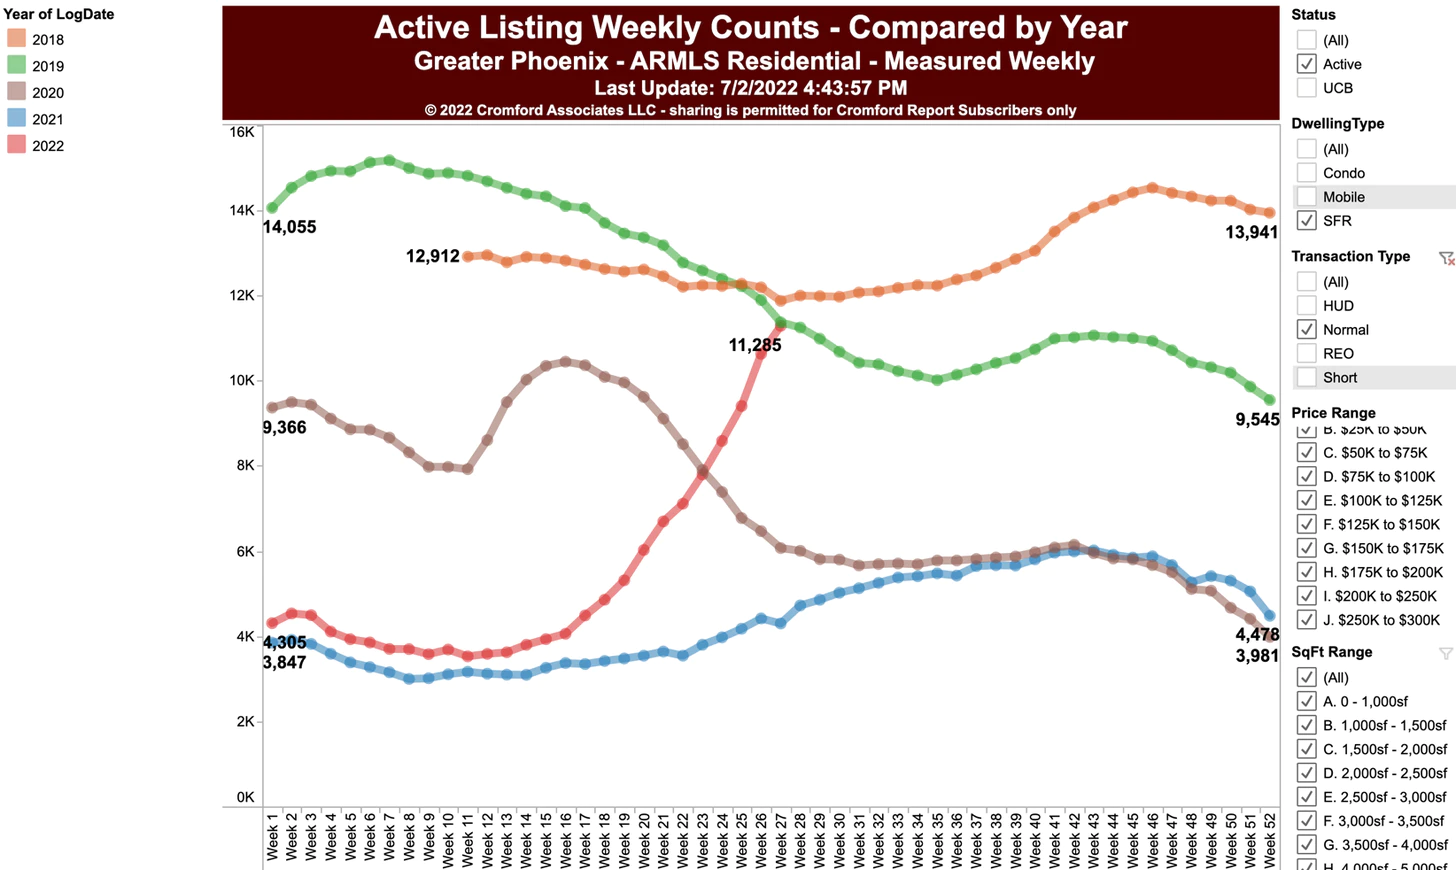
Look at the John Wake chart above. It mirrors quite a few other charts. And if you go to the Substack article the chart comes from, you get more information. Here’s a chart of active listings by week:
As you can see, that’s explosive growth and it’s now at 2019 pre-COVID levels. John also quotes from the Cromford Report, the source of some of these insights in his article:
“The rise in supply has been faster than ever seen before… active listings up 53% in a single month and up 153% compared to this time last year… percentage changes are far above anything we have previously experienced.”
“Monthly sales are down 21% from June 2021 and down 8% compared with May 2022.”
“When a housing cycle changes from positive to negative, we normally go from euphoria to uneasiness for a few months, followed by several months of denial and then several more months of pessimism before we get to the panic phase. This is what played out in 2005 and 2006. But in 2022 we seem to have taken just a week or two to skip through each of these steps and gone from euphoria to panic in no more than 10 weeks… In combination they caused the market to hit the brakes so hard it has skidded off the road.”
Thing is… despite all this skidding off the road, actual prices for Phoenix was up 19.5% YOY:
- Active Listings: 14,406 versus 5,699 last year – up 152.8% – and up 52.6% from 9,439 last month
- Pending Listings: 5,766 versus 7,294 last year – down 20.9% – and down 16.3% from 6,887 last month
- Under Contract Listings: 8,621 versus 11,378 last year – down 24.2% – and down 15.9% from 10,249 last month
- Monthly Sales: 8,059 versus 10,184 last year – down 20.9% – and down 7.7% from 8,734 last month
- Monthly Median Sales Price: $474,374 versus $397,000 last year – up 19.5% – but down 0.1% from $475,000 last month
This is what we’re seeing consistently across the country in every “OMG da Housing Bubblez” post. Listings up, pendings down, under contract down, sales down, prices down on a sequential basis but WAY UP on a YOY basis.
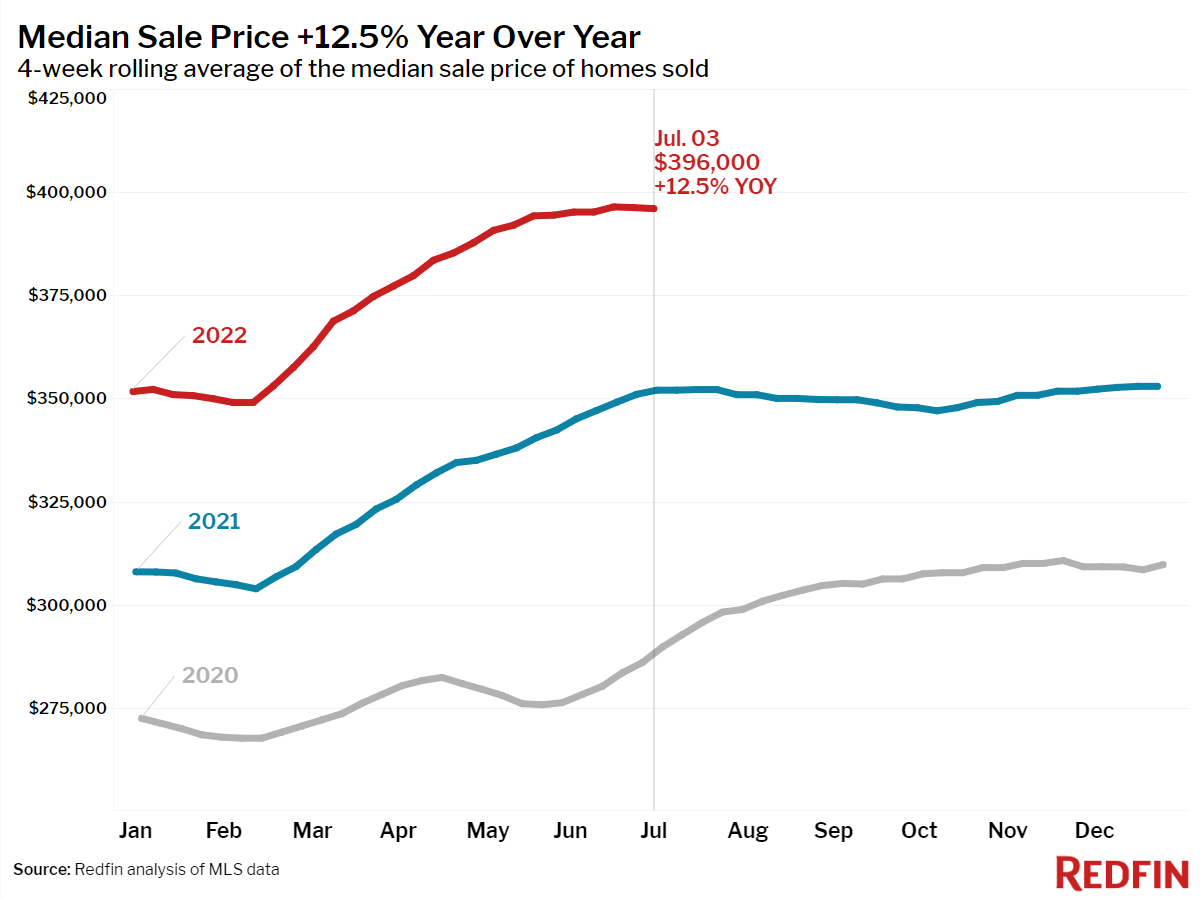
Here’s Redfin’s chart for the country as a whole:
The headline for the post talking about this is “Housing Market Update: Balance Is Returning to the Housing Market as Competition Eases.” If 12.5% increase YOY is balance….
Plus, the YOY metric alone doesn’t do justice to what’s been going on since the start of 2020. Looking just at July, we’re talking about going from ~$285K to $400K in two years.
What’s Balance?
However, we can’t really talk about the housing market collapsing or being balanced or overpriced or whatever without having some idea as to what “balanced” might actually mean. If a home is only 50% unaffordable, is that balanced? I would find that hard to argue.
So in a recent post, I talked about the last time that housing was affordable at least as defined by the U.S. government, which is to say that the price of the home should be no more than 3 times your gross income. On that metric, I pointed out that the last time housing was affordable was in 2002:
So the question is, when was buying a home last affordable for the average American family? If we go with 3.0 PTI as the last time that housing was affordable, we’re looking at 2002 when it was 3.04 when real median income was $61,190 and the median home price was $188,700.
In 2019, pre-COVID, U.S. median household income was $68,703. The median home price should have been $206,109 if we needed housing to be affordable… or put another way, “balanced.” Instead, the median home price in 2019 was $258K, or “overpriced” by $52,000.
With 2022 median household income estimated at $71,300, we need home prices to drop to $213,900 to be “balanced.” That’s about a 50% drop from today’s levels that has people talking housing collapse. In fact, it’s a 17% drop from the actual median price in 2019. So housing would need to drop 17% below what it was in 2019 for the market to be “balanced.”
I would argue that to see real “collapse” in home prices, we’d need to see them go far below affordable to downright cheap: say 1.5 or 2 times median income which is what it was in the 80s when the Boomers were buying houses.
During the Great Recession, when the Housing Bubble burst, prices dropped 33% from peak to trough. We’re talking about a 50% drop from today’s levels to get home prices to affordable.
When does anybody see that happening? Wen home prices collapse? Wen homes affordable?
Is It Just Feelings?
I suppose everything depends on what one means by “collapse.” If home prices dropped from $400K to $350K, that sure would feel like a collapse… despite that price being unaffordable by the median household on most measures of affordability. If it feels like a collapse, maybe it is a collapse.
What I’m not understanding is why anybody wants a collapse-that-isn’t-a-real-collapse. Why are so many agents and economists talking about and warning against a housing market collapse… that isn’t a true collapse? Are they just feeling nervous or worried and just transmitting their fears and concerns? Or do they want to drum up some kind of anxiety on the part of buyers and sellers today to do something, anything?
Whatever the reason, I’d suggest taking a deep breath and zooming out just a bit. Not even decades, just a couple of years, to see what’s actually going on. And the next time somebody is telling you that the housing market is collapsing, well, tell him to get into the groove cuz he’s gotta prove (or at least define) what he means by collapse.
-rsh


1 thought on “Desperately Seeking Housing Collapse”
Great article. Completely agree. Sees agents wishing for a “collapse” are agents trying to motivate sellers to list or buyers to buy. Creating urgency through panic for self-serving reasons…to try and make “making a living” a little easier for themselves.
Comments are closed.